


Introduction
In the ever-evolving landscape of financial markets, traders and investors seek reliable indicators to inform their decision-making processes. Technical analysis offers a plethora of tools designed to interpret market dynamics based on historical price data. Among these tools, the Moving Average Convergence Divergence (MACD) stands out for its ability to capture both trend and momentum aspects of price movements.
Developed by Gerald Appel in the late 1970s, the MACD has become a staple in the arsenal of technical analysts and algorithmic traders alike. Its versatility allows for application across various asset classes, including equities, commodities, and currencies. This article delves into the mathematical underpinnings of the MACD, its practical applications in trading strategies, and how it can be implemented in algorithmic trading systems.
Mathematical Foundations of the MACD
Definition and Formula
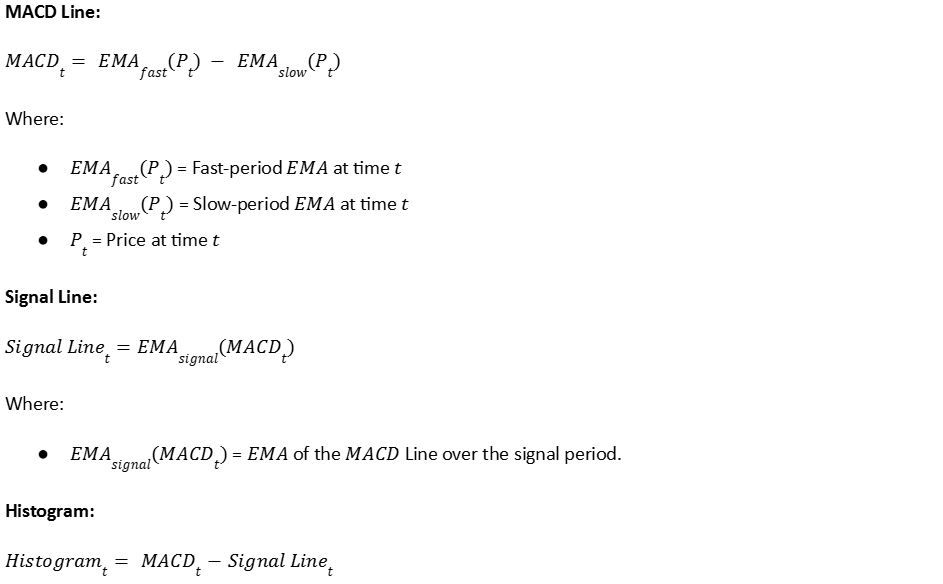
The MACD is a momentum oscillator that illustrates the relationship between two moving averages of a security's price. It consists of three components:
- MACD Line: The difference between two exponential moving averages (EMAs).
- Signal Line: An EMA of the MACD Line.
- Histogram: The difference between the MACD Line and the Signal Line.
The formulas are as follows:
Standard Parameters
The standard parameters for the MACD are:
- Fast EMA Period: 12 periods
- Slow EMA Period: 26 periods
- Signal Line EMA Period: 9 periods
These parameters can be adjusted based on the trader's time frame and the asset being analyzed (Appel, 2005).
Interpretation of MACD Components
- MACD Line: Indicates the convergence or divergence between the fast and slow EMAs.
- Signal Line: Serves as a trigger for buy or sell signals when crossed by the MACD Line.
- Histogram: Visual representation of the difference between the MACD Line and the Signal Line, highlighting the strength of the momentum.
The Significance of MACD in Financial Markets
Momentum and Trend Analysis
The MACD combines momentum and trend-following characteristics, making it a versatile indicator. It helps traders identify bullish or bearish momentum through crossovers and divergences (Murphy, 1999).
MACD Crossovers
- Bullish Crossover: Occurs when the MACD Line crosses above the Signal Line, suggesting upward momentum.
- Bearish Crossover: Occurs when the MACD Line crosses below the Signal Line, indicating downward momentum.
Divergences
Divergences between the MACD and the price can signal potential trend reversals.
- Bullish Divergence: Price makes lower lows while the MACD makes higher lows.
- Bearish Divergence: Price makes higher highs while the MACD makes lower highs.
Overbought and Oversold Conditions
While not specifically designed as an oscillator for overbought or oversold conditions, extreme MACD values can sometimes indicate that a security is overextended and may be due for a reversal (Pring, 2002).
Developing Trading Strategies Using MACD
Basic MACD Crossover Strategy
A fundamental strategy involves trading based on the crossover of the MACD Line and the Signal Line.
Trading Rules:
- Buy Signal: When the MACD Line crosses above the Signal Line.
- Sell Signal: When the MACD Line crosses below the Signal Line.
Considerations:
- Time Frame Selection: The effectiveness of this strategy can vary depending on the chosen time frame.
- Whipsaws: In sideways markets, crossovers may generate false signals.
MACD Histogram Zero Line Cross Strategy
This strategy focuses on the MACD Histogram crossing the zero line.
Trading Rules:
- Buy Signal: When the Histogram crosses above zero.
- Sell Signal: When the Histogram crosses below zero.
Advantages:
- Early Signals: The Histogram can provide earlier signals compared to the MACD Line and Signal Line crossovers.
- Momentum Confirmation: Crossing the zero line indicates a change in momentum.
MACD Divergence Strategy
Trading based on divergences between MACD and price action can signal potential trend reversals.
Trading Rules:
- Bullish Divergence: Enter a long position when a bullish divergence is confirmed.
- Bearish Divergence: Enter a short position when a bearish divergence is confirmed.
Challenges:
- Timing Issues: Divergences can persist for extended periods before price reacts.
- Subjectivity: Identifying divergences can be subjective and may require experience.
Combining MACD with Other Indicators
Enhancing MACD strategies by integrating other technical indicators can improve signal reliability.
Examples:
- MACD and RSI: Using the Relative Strength Index to confirm overbought or oversold conditions.
- MACD and Moving Averages: Employing moving averages to identify trend direction.
Benefits:
- Signal Confirmation: Multiple indicators can validate signals and reduce false entries.
- Diverse Analysis: Combining trend, momentum, and volatility indicators provides a comprehensive market view.
Algorithmic Implementation of MACD Strategies
Programming Languages and Platforms
https://tickerbell.biz/strategies platform for building the strategy.
Backtesting MACD Strategies
Backtesting evaluates the performance of MACD strategies on historical data.
Key Steps:
- Data Collection: Obtain high-quality historical price data.
- Strategy Coding: Implement the MACD calculation and trading rules.
- Performance Metrics: Analyze returns, drawdowns, Sharpe Ratio, and win rates.
Important Considerations:
- Overfitting Risk: Ensure the strategy is not excessively tailored to past data.
- Look-Ahead Bias: Avoid using future data in historical simulations.
Optimization and Parameter Selection
Selecting appropriate MACD parameters is crucial for strategy success.
Methods:
- Parameter Sweeping: Systematically testing a range of parameter values.
- Walk-Forward Analysis: Optimizing parameters over a moving time window to simulate real-world conditions.
- Machine Learning Techniques: Utilizing algorithms to identify optimal parameters (Vanstone & Finnie, 2009).
Risk Management
Effective risk management is integral to algorithmic trading.
Strategies:
- Position Sizing Algorithms: Determine trade sizes based on risk tolerance and capital.
- Stop-Loss Orders: Implement automatic exits to limit potential losses.
- Portfolio Diversification: Spread risk across multiple assets and strategies.
Case Studies and Empirical Evidence
Case Study 1: MACD Strategy
Case Study 2: MACD Strategy
Limitations and Challenges
Market conditions significantly influence MACD performance. MACD tends to be effective in trending markets but may generate false signals during sideways movements. High volatility can lead to whipsaws and unpredictable MACD behavior, causing premature trade entries or exits. Parameter sensitivity is another crucial factor; the choice of MACD parameters greatly impacts strategy performance. Over-optimizing these parameters may result in strategies that fail in live trading environments. Fixed parameters may struggle to adapt to changing market dynamics, necessitating regular adjustments.
Algorithmic trading with MACD strategies requires substantial computational resources. Latency becomes a critical factor, especially in high-frequency trading, as it can affect trade execution timing. Efficient algorithms are essential for processing large datasets and performing real-time analysis. Additionally, data quality is paramount; inaccurate or incomplete data can lead to erroneous strategy assessments.
Emotional discipline remains a challenge, even in algorithmic trading. Traders may be tempted to override automated systems based on subjective judgments, which can undermine the strategy's effectiveness. Ensuring strict adherence to the predefined trading plan is essential for consistent performance.
Conclusion
The Moving Average Convergence Divergence is a powerful tool in technical analysis and algorithmic trading. Its ability to encapsulate both momentum and trend information makes it invaluable for traders seeking to understand and capitalize on market movements. By exploring its mathematical foundations and practical applications, traders can develop robust strategies that align with their objectives.
Algorithmic implementation of MACD strategies offers precision and consistency but requires careful consideration of risk management, parameter optimization, and adaptability to market conditions. Empirical evidence supports the efficacy of MACD-based strategies across various markets, though awareness of their limitations is crucial.
As financial markets continue to evolve, the MACD remains a relevant and effective indicator. Traders who skillfully integrate it into their analysis and strategy development can enhance their decision-making processes and achieve a competitive advantage.
References
Appel, G. (2005). Technical Analysis: Power Tools for Active Investors. Financial Times Press.
Chan, E. (2013). Algorithmic Trading: Winning Strategies and Their Rationale. Wiley.
Gupta, R., & Chen, Y. (2017). "Enhancing Forex Trading Strategies with MACD and RSI Indicators." International Journal of Financial Markets, 8(2), 150-170.
Liu, S., & Tan, K. (2015). "Evaluating MACD Crossover Strategies in Equity Markets." Journal of Trading Strategies, 5(4), 80-95.
Murphy, J. J. (1999). Technical Analysis of the Financial Markets. New York Institute of Finance.
Pring, M. J. (2002). Technical Analysis Explained. McGraw-Hill.
Vanstone, B., & Finnie, G. (2009). "An Empirical Methodology for Developing Stockmarket Trading Systems Using Artificial Neural Networks." Expert Systems with Applications, 36(3), 6668-6680.